

“The system has been live for three months. Is it actually working?” the owner asks at the weekly meeting. The project lead thinks for a moment: “It's stable. No downtime in three months.” The sales manager adds: “People are still getting used to it.” The accountant says: “Month-end reconciliation still takes forever.” All three are telling the truth. The owner still doesn't know whether the money was well spent.
I'm Johnny Yang, founder of Brightstream Technology in Taiwan. I've led teams building systems for seven years, across more than 252 projects in over 32 industries. After a system goes live, the question owners ask me most isn't about features. It's this: “How do I know it's actually doing anything?”
The short answer: three months after an ERP goes live, don't start with revenue or headcount saved. Those numbers take longer to show up, and there is too much noise in them. What you should look at now is three layers and eight numbers. Layer one is “is anyone using it”: the share of documents created in the system, actual users as a share of intended users, the share of entries logged after the fact, and how many shadow Excel files are still alive in the company. Layer two is “did it get faster and more accurate”: order-to-shipment processing time, inventory record discrepancies, and days to close the month. Layer three is “is anyone looking after it”: how long it takes to fix a reported problem. If layer one fails, the numbers in the other two can't be trusted. If layer one passes, layer two is what your money actually bought.
Why not just look at revenue and headcount?
Let me take the owner's side first. You spent several hundred thousand, maybe more than NT$1,000,000. Of course you want to know the return. The most intuitive indicators are whether revenue went up and whether headcount went down. That instinct isn't wrong. In the end the accounting has to come down to money.
But looking at revenue at three months has two problems. First, revenue is driven by the economy, seasons, sales, and products. The system is one factor among many. If revenue is good this quarter, you can't tell whether that's the system or peak season. Second, changes in headcount usually lag. If the system cuts a role's workload in half, you don't restructure the next day. More likely you wait until someone leaves and don't replace them, or you move people to other work. That takes six months or more to show up.
The bigger issue is the third problem: at three months, the system often isn't really being used yet. On the surface everyone logs in. In practice half the orders are still running through Excel. Calculating revenue at this point means calculating ROI on a system that hasn't actually gone live.
So reverse the order: first confirm people are using it, then check whether things got faster, and only then count the money.
Layer one: is anyone using it? Start with these four numbers
Number one: share of documents created in the system
Take one month of sales orders, shipping documents, and purchase orders. Compare “what's in the system” with “what actually happened.” The closer to all of it, the better. If a big chunk of documents is still handled on paper or in LINE first and entered into the system at month-end, the system is just a ledger, not a place where work gets done.
Number two: actual users as a share of intended users
Not how many accounts were created, and not login counts. The question is: “Did the people who should be working in the system leave records in it this month?” Did sales create quotations in the system? Did the warehouse record goods in and out in the system? Did purchasing place orders in the system?
I weigh this number heavily. Brightstream worked with a printing company that had spent more than NT$1,000,000 on two ERP systems that nobody used. The third one was built around their own workflow, and staff adoption went from under 20% to over 90%. The problem with the first two wasn't missing features. Nobody used them. The full story is in Spent over NT$1,000,000 on two ERPs nobody used.
Number three: share of entries logged after the fact
Among documents that are in the system, some were created on the spot. Others were entered in a batch before going home, on the weekend, or at month-end. A high after-the-fact share means the floor sees the system as an obstacle, so they do the work first and fill in the data later. The timestamps on that data are wrong. The reports have numbers in them, but the times don't match when things actually happened.
Number four: how many shadow Excel files are left
Ask each department head: “Which Excel files are you still maintaining?” Every Excel file still being updated means there's something the system doesn't do, or that people don't trust the system's numbers. Having a few left at three months isn't strange. What matters is that the count goes down every month.
If these four numbers look bad, don't rush to add features. The reasons staff stay on Excel usually come down to a handful, and each needs a different fix. I've laid them out in Why your team still secretly uses Excel after you bought a system.
Layer two: did it get faster and more accurate? Then look at these three numbers
Only look at layer two once layer one passes. This layer is what your money actually bought.
Number five: order-to-shipment processing time
Pick your most central workflow and measure how long it takes from start to finish. For a trading company, that's usually from customer order to goods out the door. For a manufacturer, it might be from order received to work order issued. It doesn't need to be precise. Sample one week of orders and look at the average and the slowest few.
In Brightstream's projects, a dessert brand cut order processing time by 88%, and a bakery went from 4 hours a day copying orders by hand to 30 minutes. Changes like these usually show up within three months, because they directly reflect whether duplicate data entry has gone away.
Number six: inventory record discrepancies
Spot-count a few items and compare the quantity in the system with the quantity on the shelf. Before go-live, people often say “the system's inventory is wrong.” After go-live, the gap should shrink. If it grows instead, it usually means goods in and out aren't being recorded on the spot, or some shipments are bypassing the system.
Number seven: days to close the month
How many days does it take each month to close the books and get a P&L? After go-live, reconciliation and consolidation work should shrink. If month-end close doesn't get shorter, the accountant is still recalculating the system's numbers in Excel, and the problem is usually back in layer one.
Layer three: is anyone looking after it? Finally, this one number
Number eight: how long it takes to fix a reported problem
Three months after go-live, there will be problems: a report that won't run, a returns flow that gets stuck, a discount calculated wrong. List every problem reported in those three months and check how long each took from report to fix, and whether it came back.
This number reflects whether whoever maintains the system is actually looking after it. In Brightstream's maintenance, critical issues are patched within 24 hours of being reported and high-risk ones within 72 hours. That's written into the maintenance contract. If your maintenance contract doesn't specify response times, three months in is a good time to add them. For how to word the clauses, see What should a system maintenance contract include? 12 items to check before signing.
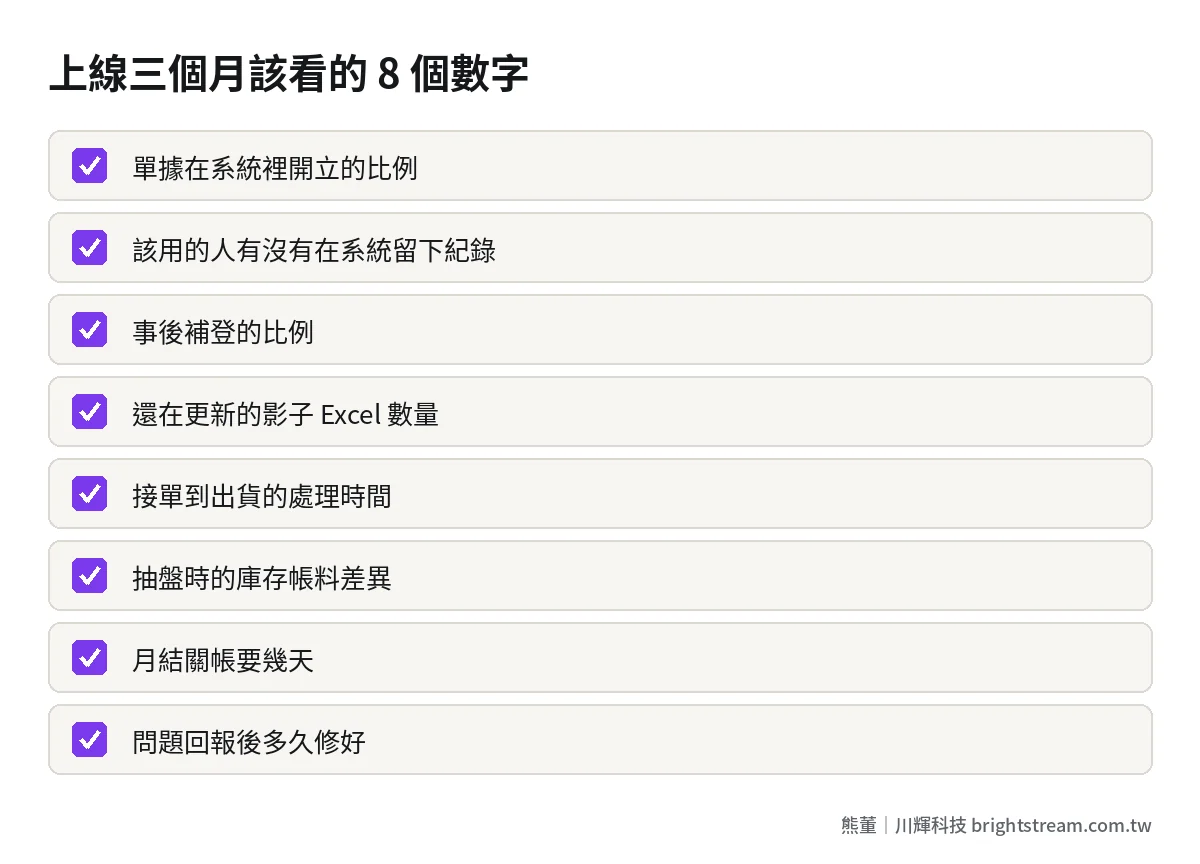
How to measure the 8 numbers, and what should worry you
You can use the table below as is. Nothing in the “How to measure” column needs an engineer. A manager doing spot checks can handle it.
| Number | How to measure | What good looks like | What should worry you |
|---|---|---|---|
| Share of documents in the system | Sample one month of documents, compare system vs. reality | Closer to all of them each month | A big chunk entered only at month-end |
| Actual users | Did the people who should use it leave records this month | Someone working in it in every department | One or two people entering data for everyone |
| After-the-fact entries | Compare document creation time with when it actually happened | Mostly created on the spot | Clustered before going home or at month-end |
| Shadow Excel | Ask each department which files they still maintain | Fewer each month | Rising instead, or new ones appearing |
| Processing time | Sample one week of the core workflow, check average and slowest | Shorter than before go-live | About the same as before go-live |
| Inventory discrepancy | Spot-count a few items, compare system vs. shelf | Gap shrinking | Gap growing |
| Month-end close days | Days from month-end to having a P&L | Shorter than before go-live | Accountant still recalculating in Excel |
| Fix time | List dates problems were reported and resolved | Time limits met, no repeats | No response, the same thing keeps breaking |
What if you don't have pre-go-live numbers? Very common. Use month one as the baseline and compare month three against it. Whether the system is improving is about direction, not absolute values.
Who measures, and how often?
Don't hand these eight numbers to the vendor, and don't hand them only to IT. Numbers the vendor measures will tend to be framed from the flattering angle. IT can measure login counts but doesn't know which orders on the floor never made it into the system. The better approach is to assign one manager to each number: the sales manager owns the share of documents in the system and processing time, the warehouse manager owns inventory discrepancy, the accounting manager owns month-end close days, and the project lead owns fix time.
It doesn't need to be frequent. Once a month is enough. Put it in the first ten minutes of the monthly meeting, one line per number, compared with last month. The point isn't how good the numbers look. The point is that everyone knows the owner is watching. I've seen many companies where the biggest turning point in system results wasn't a new feature. It was the owner starting to look only at numbers from the system in meetings and refusing to accept anyone's Excel. That act alone starts to improve the four numbers in layer one.
When the numbers look bad, which one do you fix first?
This is the most important section of this post. If several of the eight numbers look bad, the owner's instinct is to fix everything at once: tell the vendor to add features, tell managers to watch people, tell accounting to speed up. That usually makes things messier.
The order is this: fix layer one first, then layer two. The reason is simple. Every number in layer two is calculated from layer-one data. If documents aren't in the system, you can't measure processing time accurately. If goods in and out aren't recorded on the spot, the inventory gap can't shrink. If the accountant doesn't trust the system's numbers, month-end close won't get faster.
Within layer one, I look at “actual users” and “shadow Excel” first. These two numbers tell you who isn't using it, and at which step. Find that step, go to the floor and watch how the person actually works. You'll usually find one of two causes: a step in the system is more cumbersome than the old way, or the manager is still collecting Excel. The first means adjusting the system. The second means adjusting management.
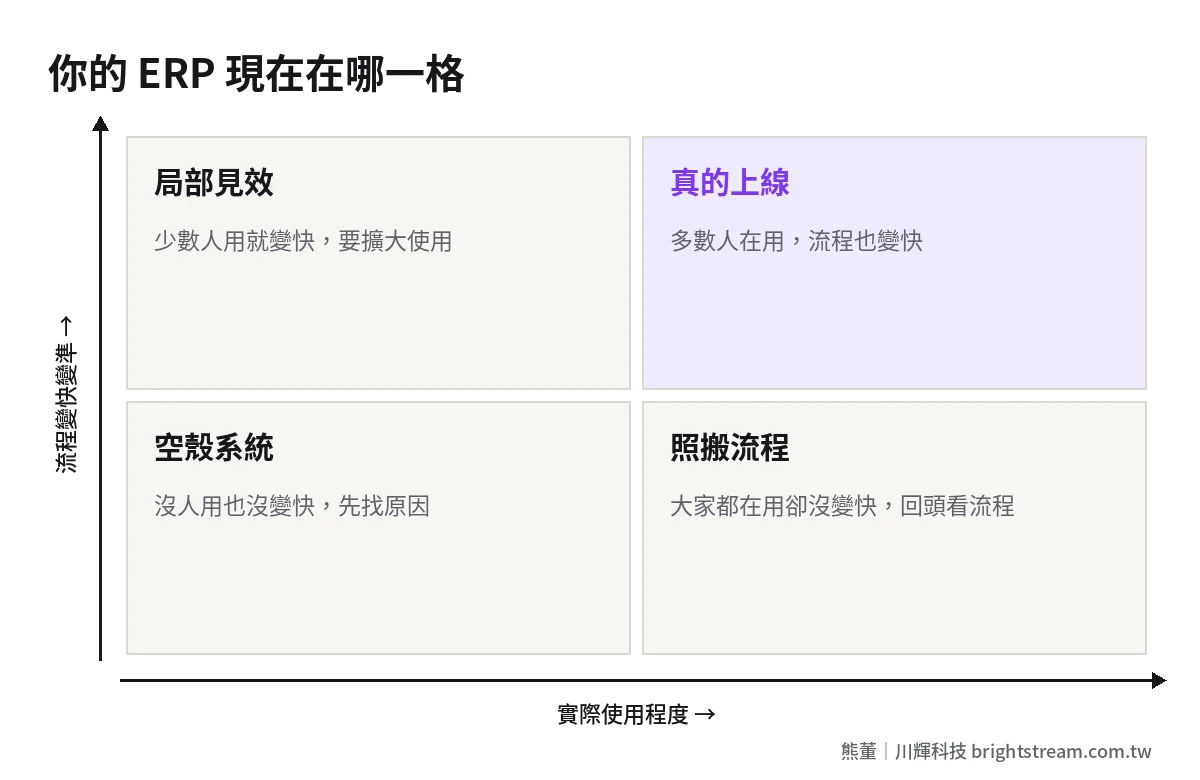
The chart above helps you figure out which box you're in. The most dangerous is the bottom right: everyone is using it, but the workflow hasn't gotten faster. That usually means the system moved the old process into the computer unchanged, with every redundant step still there. What you need then isn't more training. You need to go back and look at the process. For handling staff resistance, see What to do when staff won't use the new system: rescuing adoption.
After three months, when do you start counting the money?
Once layer one is stable and layer two starts to move, that's roughly when to start counting the money. What you calculate isn't “how much the system earned me.” It's three more concrete numbers:
- Where the saved time went. If processing time got shorter, was the freed-up labor put toward something more valuable, like chasing receivables, following up with customers, or business development? If nobody assigns the saved time, it just becomes idle time.
- What the avoided errors are worth. Wrong goods shipped, wrong prices, missed invoices: each one has a cost. Compare the error count before and after go-live, multiply by the cost of handling each one, and you have a concrete figure.
- What the total spend works out to. Take the build cost plus monthly maintenance, spread it over the years of use, and compare it with the two numbers above. For how to calculate five-year total cost, see How to calculate ERP five-year total cost: the build fee is just the start.
Once you have these three numbers, you're in a position to decide whether to invest further in the next phase, and where.
A hypothetical example. Say a 50-person trading company goes live, and the sales support staff spend two fewer hours a day re-entering orders. That's over forty hours a month. If those forty hours go toward chasing receivables and organizing customer follow-ups, that's visible value. If everyone just has a quieter afternoon, that benefit doesn't exist on the books. Time the system saves only turns into money through management.
FAQ
How long after an ERP goes live can you see results?
Usage results show up within three months: whether documents are in the system, whether people are using it, how much is entered after the fact. Workflow speed and accuracy usually emerge gradually over three to six months. The effect on revenue and headcount takes six months or more, and has to be separated from factors like the economy and seasonality.
What KPIs should you use for ERP implementation results?
Use three layers. Usage: share of documents in the system, actual users, after-the-fact entries, number of shadow Excel files. Efficiency: core workflow processing time, inventory discrepancy, month-end close days. Maintenance: problem fix time. Confirm usage is fine first. Only then do the efficiency numbers mean anything.
Can you still compare if you didn't keep data before go-live?
Yes. Use the first month after go-live as the baseline and compare month three against month one. You're looking at direction, not absolute values. You can also dig back through old Excel files, shipping records, or month-end close times to roughly estimate the pre-go-live level.
If staff are still using Excel after the ERP goes live, is the system bad?
Not necessarily. There are three common causes: a step in the system is more cumbersome than the old way, managers are still collecting Excel reports, or staff don't trust the system's numbers. Go to the floor first and find which step and which cause. Then decide whether to adjust the system or adjust management. Don't go straight to asking the vendor for more features.
Go-live isn't the finish line. Three months is the first checkup
Three months after an ERP goes live, the question isn't “is it working.” It's “is anyone using it, did it get faster, is anyone looking after it.” Once each of those has an answer, you know where the money went and what to fix next.
If your system is about to go live, or it's already live and you can't say what it's delivered, take a look at How ERP implementation works to see how we build these three post-go-live layers into the implementation plan from the start.